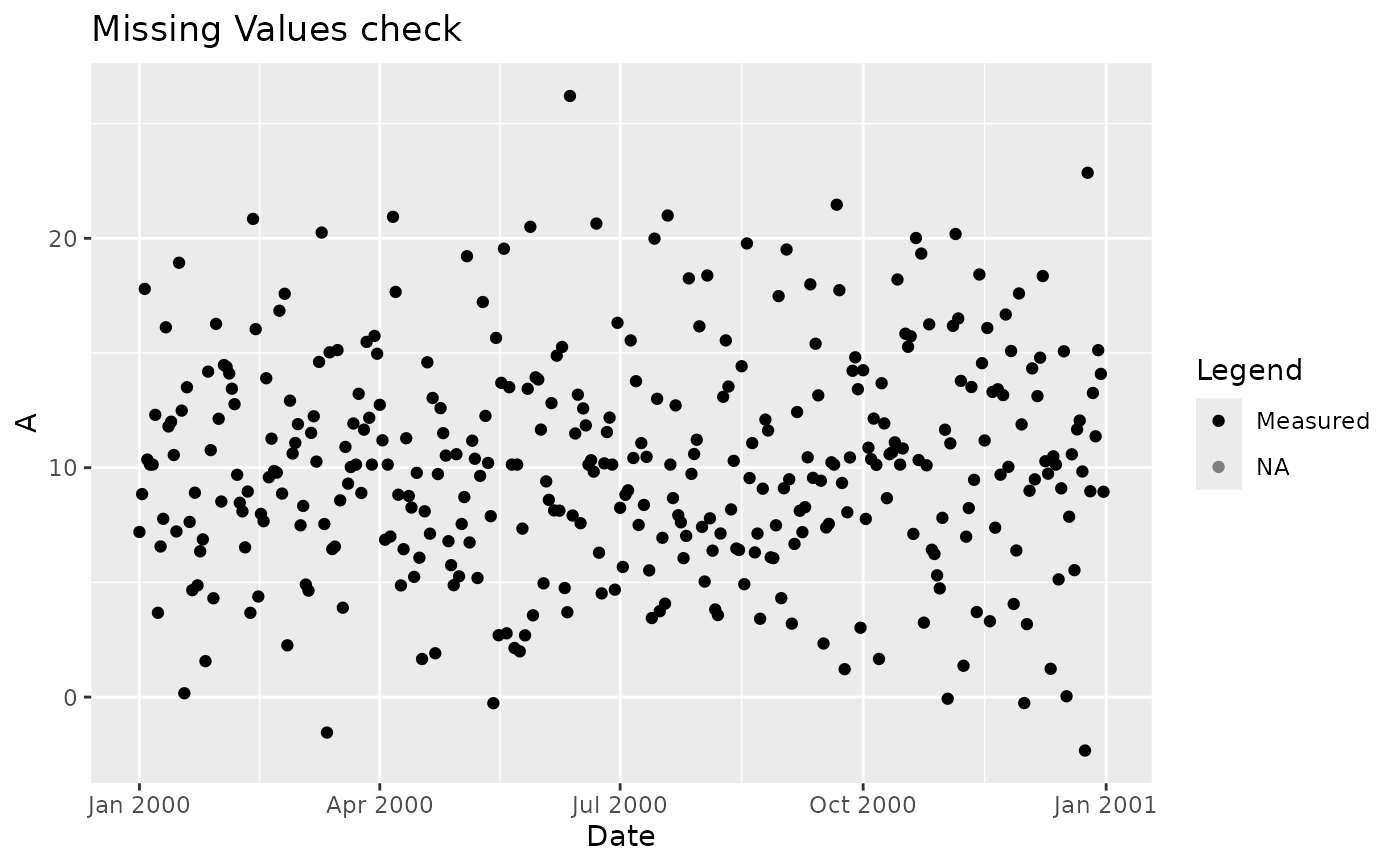
Replaces NAs with the series mean to make gaps visually identifiable as a horizontal line at the mean level. Intended for quick diagnostic checks.
Examples
# Synthetic xts with artificial gaps
set.seed(123)
dates <- seq(as.POSIXct("2000-01-01"), as.POSIXct("2000-12-31"), by = "day")
vals <- matrix(rnorm(length(dates) * 2, 10, 5), nrow = length(dates), ncol = 2)
colnames(vals) <- c("A", "B")
vals[sample(length(vals), 20)] <- NA
ts <- xts::xts(vals, order.by = dates)

plot_missing(ts)
#> Warning: Removed 346 rows containing missing values or values outside the scale range
#> (`geom_point()`).