
Empirical normal-score transform of an xts time series: values are mapped to standard normal quantiles via their empirical cumulative distribution function (ranking with average ties). Optionally applied per calendar month to preserve seasonal structure in cyclo-stationary processes.
Arguments
- ts
An xts object containing the time series data. Multi-column xts are supported; each column is normalised independently.
- dist_period
Character; the distribution period for normalisation. Use
"monthly"for per-calendar-month normalisation orNAfor the entire series. Default"monthly".- ignore_zeros
Logical; if
TRUE, zero values (at or belowzero_threshold) are excluded before normalisation. DefaultFALSE.- zero_threshold
Numeric; threshold below which values are treated as zero. Default
0.01.
Examples
# Synthetic daily precipitation
set.seed(42)
n <- 365 * 3
dates <- seq(as.POSIXct("2000-01-01", tz = "UTC"), by = "day", length.out = n)
precip <- pmax(0, rnorm(n, mean = 3, sd = 5))
ts <- xts::xts(precip, order.by = dates)
# Monthly normal-score transform
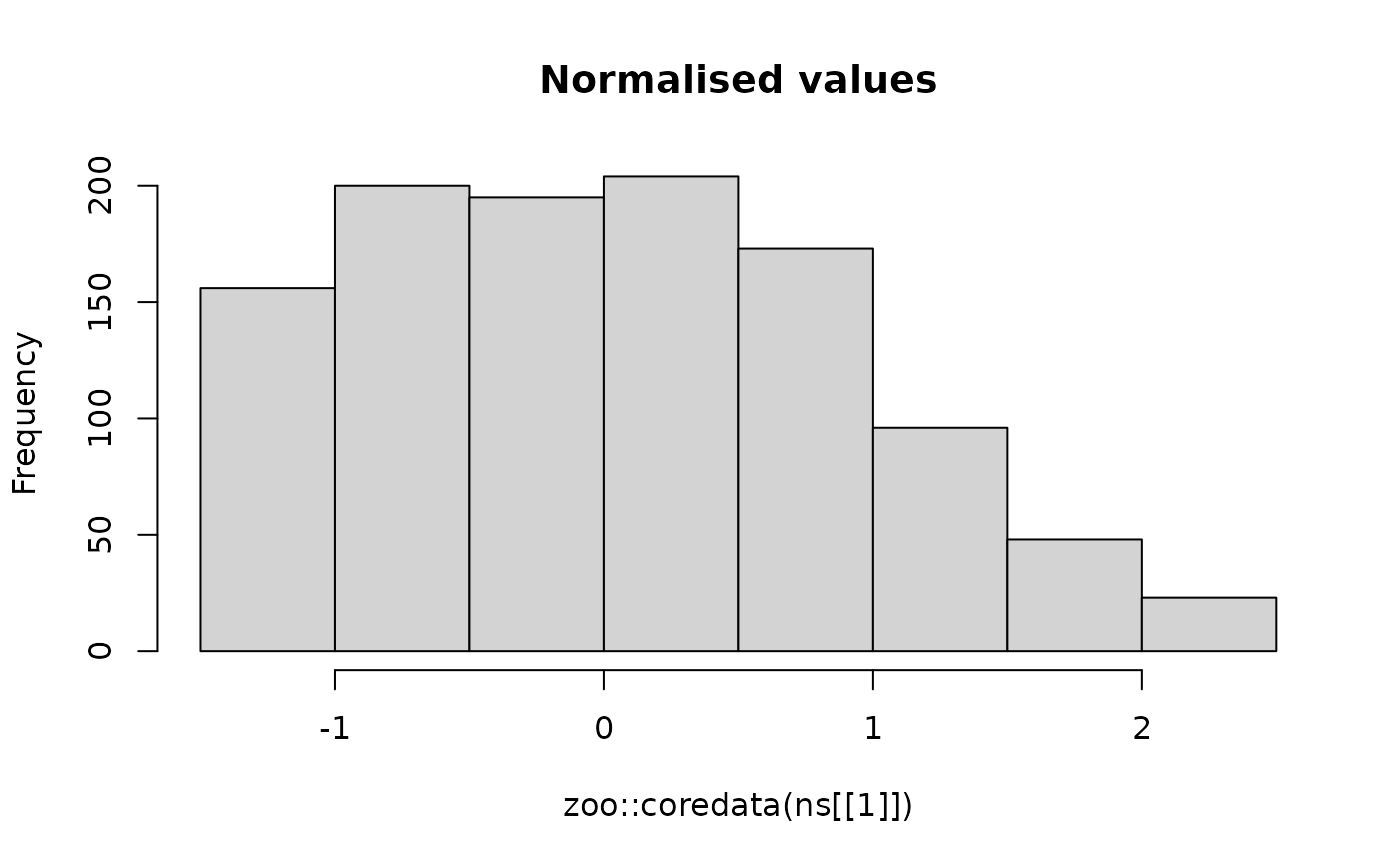
ns <- normalise_xts(ts, dist_period = "monthly")
hist(zoo::coredata(ns[[1]]), main = "Normalised values")
 # Full-series transform
ns_full <- normalise_xts(ts, dist_period = NA)
# Full-series transform
ns_full <- normalise_xts(ts, dist_period = NA)