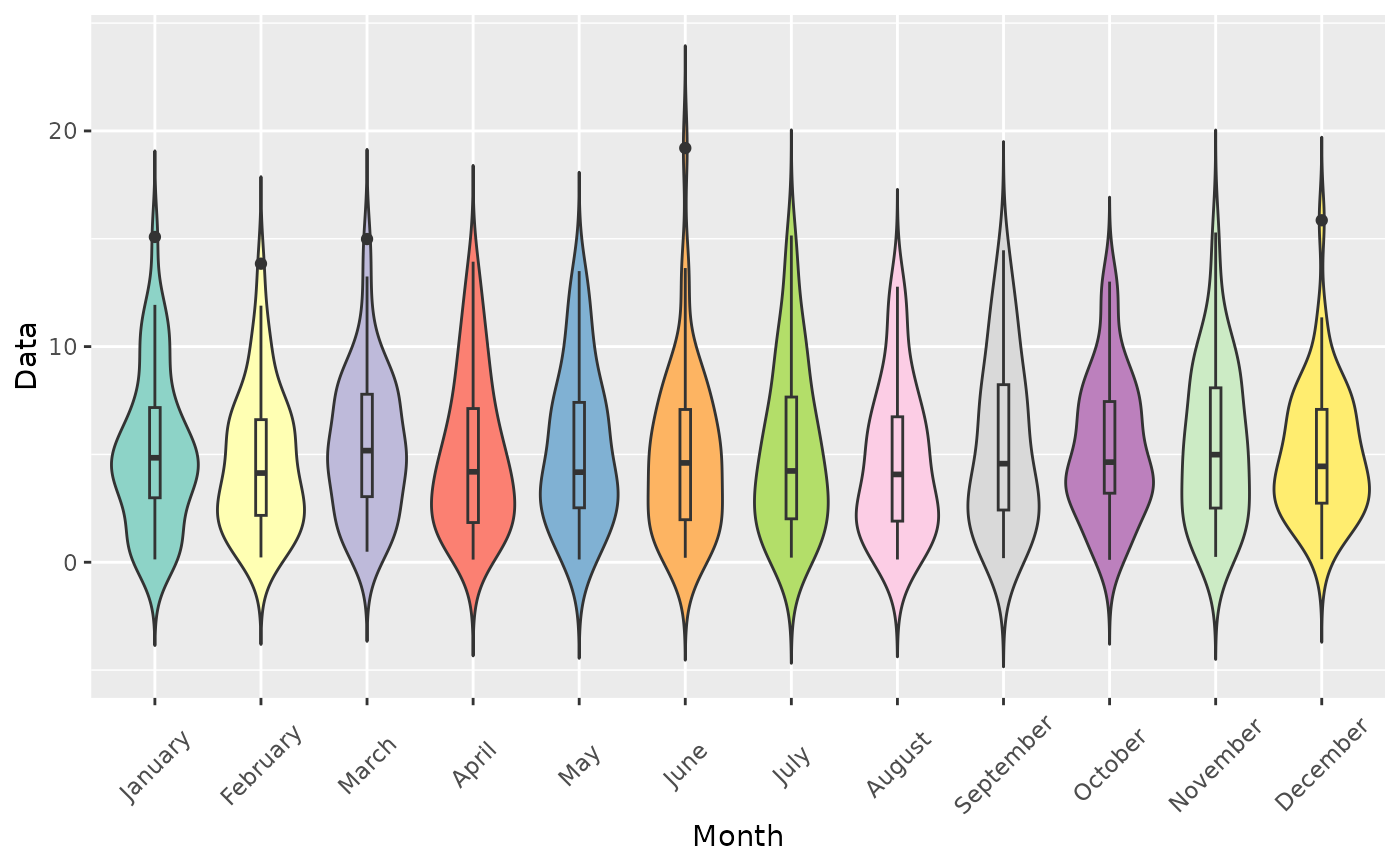
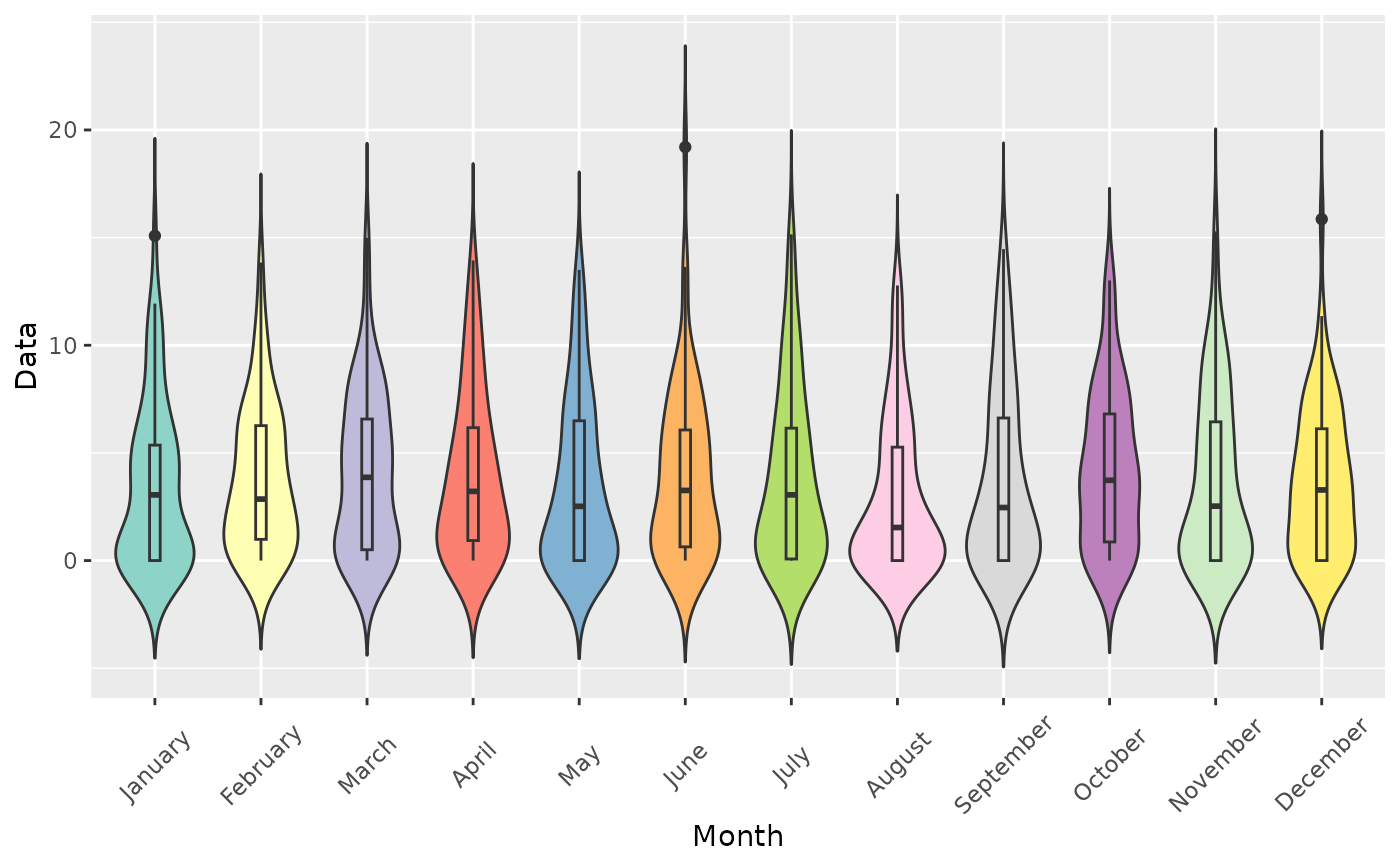
Produces a ggplot2 violin plot of monthly values from an xts time series. Single-column series overlay a boxplot inside each violin; multi-column series facet by variable using a brewer fill palette.
Arguments
- ts
An xts object containing the time series data. Multi-column xts are supported; each column is treated as a separate variable.
- palette
Character; the RColorBrewer palette name for the fill scale. Default
"Set3".- ignore_zeros
Logical; if
TRUE, values at or belowzero_thresholdare excluded. DefaultFALSE.- zero_threshold
Numeric; threshold below which values are treated as zero. Default
0.01.
Examples
# Synthetic daily precipitation
set.seed(123)
n <- 365 * 2
dates <- seq(as.POSIXct("2000-01-01", tz = "UTC"), by = "day", length.out = n)
precip <- pmax(0, rnorm(n, mean = 3, sd = 5))
ts <- xts::xts(precip, order.by = dates)
monthly_violins(ts, palette = "Set3")
 # Exclude zeros
monthly_violins(ts, ignore_zeros = TRUE, zero_threshold = 0.1)
# Exclude zeros
monthly_violins(ts, ignore_zeros = TRUE, zero_threshold = 0.1)