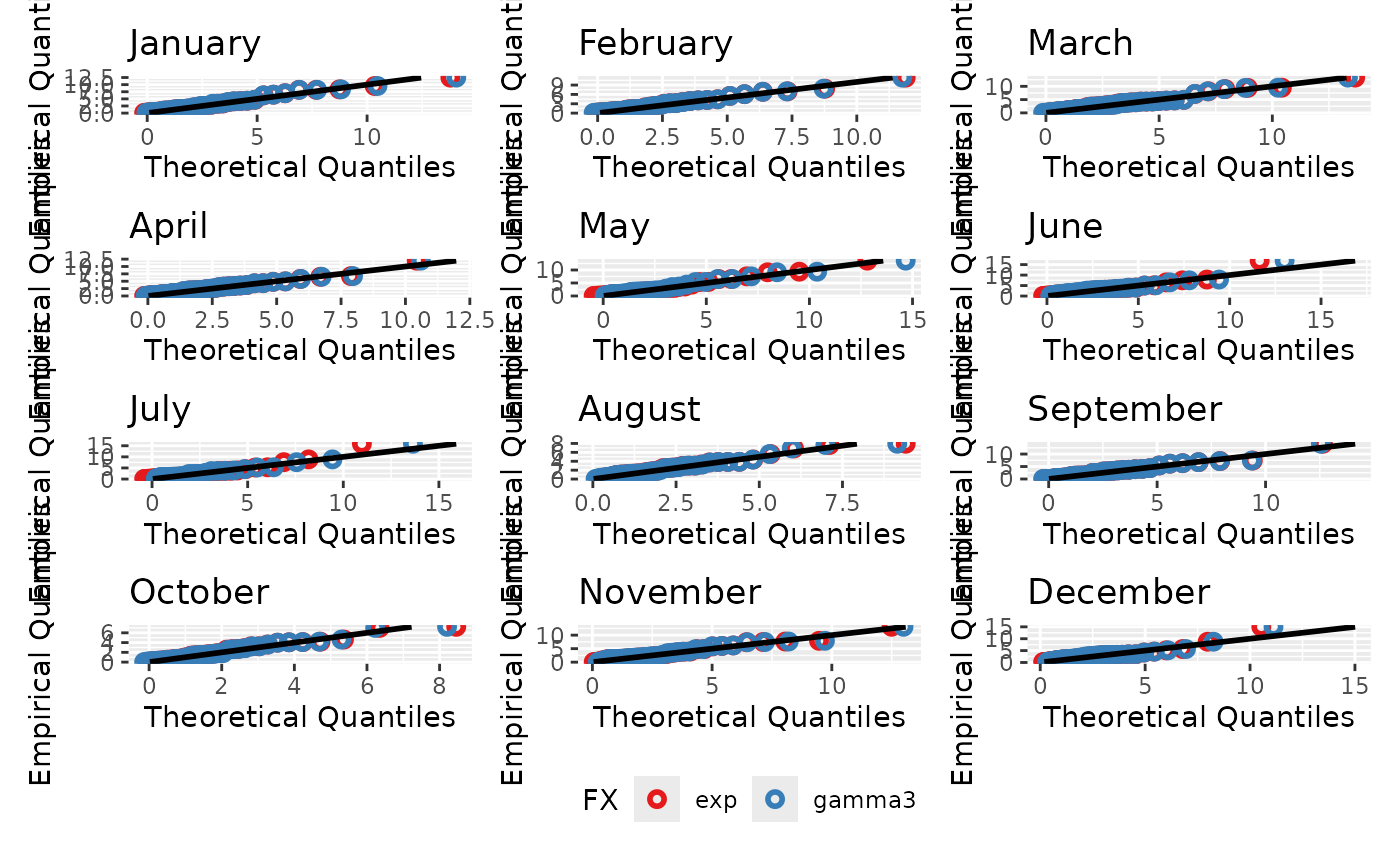
Fits a list of candidate distributions to each calendar month of
a time series via the L-moments method. The series is partitioned by month,
and fitlm_multi is applied to each monthly subset independently.
Parameter estimates for each candidate are aggregated into monthly tables,
and the six goodness-of-fit metrics (MLE, CM, KS, MSEquant, DiffOfMax,
MeanDiffOf10Max) are collected into per-candidate matrices with months as
rows. Twelve-panel Q-Q and P-P diagnostic grids are assembled with
patchwork::wrap_plots, using the nrow and ncol arguments
to control the layout. Months absent from the data are filled with empty
ggplot panels so that the grid always has twelve cells. The returned
list provides the monthly parameter tables, GoF matrices, and the combined
Q-Q and P-P panel plots.
Usage
fitlm_monthly(
  ts,
  candidates,
  ignore_zeros = FALSE,
  zero_threshold = 0.01,
  nrow = 4,
  ncol = 3,
  order = NULL
)
Arguments
- ts
An xts object containing the time series data.
- candidates
A character vector of distribution names to fit.
- ignore_zeros
A logical value, if
TRUEzeros will be ignored. Default isFALSE.- zero_threshold
The threshold below which values are considered zero. Default is 0.01.
- nrow
Number of rows for the diagnostic plot grid. Default is 4.
- ncol
Number of columns for the diagnostic plot grid. Default is 3.
- order
Optional named list mapping a candidate name to the vector of L-moment orders matched by its optimiser, e.g.
list(gengamma = 1:5, expweibull = 1:3). Only the numerically-fitted distributions accept it; passed through tofitlm_multi. DefaultNULL.
Value
A list with components params_monthly (a list of data frames,
one per candidate, with columns for each month), GoF_monthly (a list
of transposed matrices, one per candidate, with months as rows and GoF
metrics as columns), monthly_QQplot, and monthly_PPplot
(twelve-panel diagnostic grids).
Examples
# Two years of daily precipitation-like data
x <- xts::xts(rgamma(730, shape = 0.8, scale = 3),
         order.by = seq.Date(as.Date("2020-01-01"), by = "day", length.out = 730))
x[sample(1:730, 200)] <- 0

candidates <- c('exp', 'gamma3')
monthly_fits <- fitlm_monthly(x, candidates = candidates, ignore_zeros = TRUE)
monthly_fits$monthly_QQplot